Find Your RAID's Periodicity
Determining the parameters within a RAID configuration involves analyzing the entropy patterns found in each of the individual member drives.
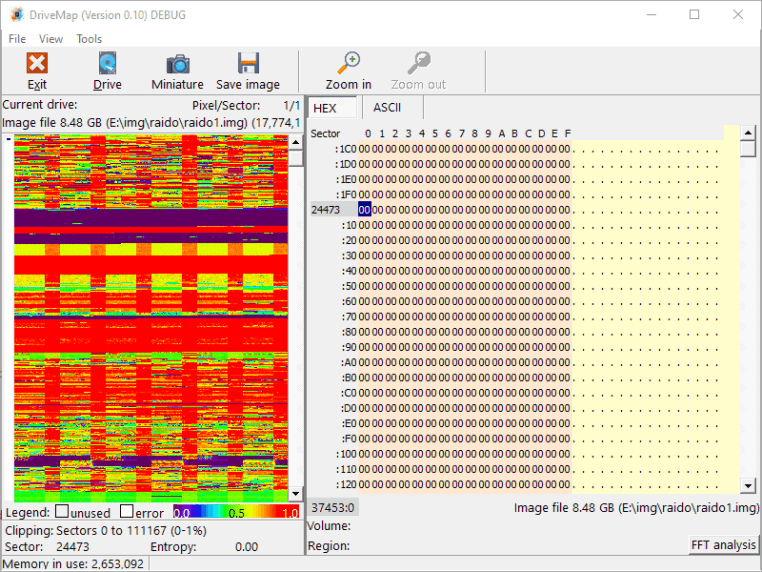
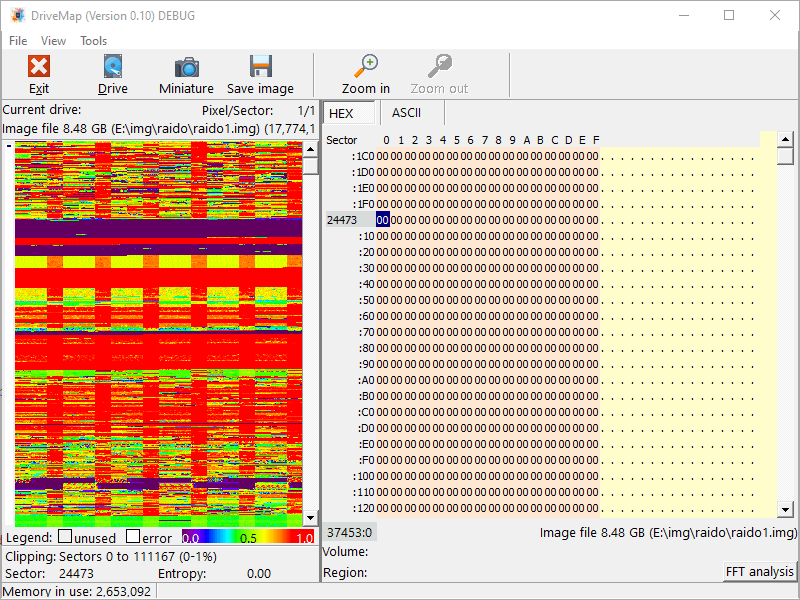
In this image, DriveMap reveals a characteristic pattern representative of a RAID-5 configuration. By measuring the width of the bars within the display, you can observe that the higher-entropy red bars span 16 sectors, while the lower-entropy gaps cover 32 sectors. This particular drive is a member of a 3-drive RAID-5 setup with a block size of 16 sectors, resulting in a complete period spanning 48 sectors.
This pattern arises due to the way RAID parity blocks are calculated, involving XOR operations on data from the other drives. XORed data typically exhibits higher entropy than the original data, which is why you see the parity blocks depicted in red approaching a near-maximal entropy value of 1, while other areas display significantly lower entropy, averaging around 0.5.
The measurement of data entropy used here is based on "Shannon Entropy," which provides an indication of the average level of "information," "surprise," or "uncertainty" inherent in the data under consideration. For a more in-depth understanding of this concept, you can explore its theory at https://en.wikipedia.org/wiki/Entropy_(information_theory).


